#!pip install ANNarchySTDP - single synapse
![]()
![]()
This notebook demonstrates the online implementation of the spike time-dependent plasticity (STDP) rule for a pair of neurons.
import numpy as np
import matplotlib.pyplot as plt
import ANNarchy as ann
ANNarchy 5.0 (5.0.3) on linux (posix).The STDP learning rule maintains exponentially-decaying traces for the pre-synaptic and post-synaptic spikes.
\tau^+ \, \frac{d x(t)}{dt} = -x (t)
\tau^- \, \frac{d y(t)}{dt} = -x (t)
LTP and LTD occur at spike times depending on the corresponding traces.
- When a pre-synaptic spike occurs, x(t) is incremented and LTD is applied proportionally to y(t).
- When a post-synaptic spike occurs, y(t) is incremented and LTP is applied proportionally to x(t).
STDP = ann.Synapse(
    parameters = dict(
        tau_plus = 20.0,
        tau_minus = 20.0,
        A_plus = 0.01,
        A_minus = 0.01,
        w_min = 0.0,
        w_max = 2.0,
    ),
    equations = [
        # Pre-synaptic trace
        ann.Variable('tau_plus * dx/dt = -x', method='event-driven'),
        # Post-synaptic trace
        ann.Variable('tau_minus * dy/dt = -y', method='event-driven'),
    ],
    pre_spike="""
        g_target += w
        x += A_plus * w_max
        w = clip(w - y, w_min , w_max) # LTD
    """,
    post_spike="""
        y += A_minus * w_max
        w = clip(w + x, w_min , w_max) # LTP
    """
)
We create two dummy populations with one neuron each, whose spike times we can control.
net = ann.Network()
pre = net.create(ann.SpikeSourceArray([[0.]]))
post = net.create(ann.SpikeSourceArray([[50.]]))
We connect the population using a STDP synapse.
proj = net.connect(pre, post, 'exc', STDP)
proj.all_to_all(1.0)
<ANNarchy.core.Projection.Projection at 0x7a08e18a2560>net.compile()Compiling network 1... OKThe presynaptic neuron will fire at various times between 0 and 100 ms, while the postsynaptic neuron keeps firing at 50 ms.
pre_times = np.linspace(100.0, 0.0, 101)weight_changes = []
for t_pre in pre_times:
# Reset the populations
pre.clear()
post.clear()
pre.spike_times = [[t_pre]]
post.spike_times = [[50.0]]
# Reset the traces
proj.x = 0.0
proj.y = 0.0
# Weight before the simulation
w_before = proj[0].w[0]
# Simulate long enough
net.simulate(105.0)
# Record weight change
delta_w = proj[0].w[0] - w_before
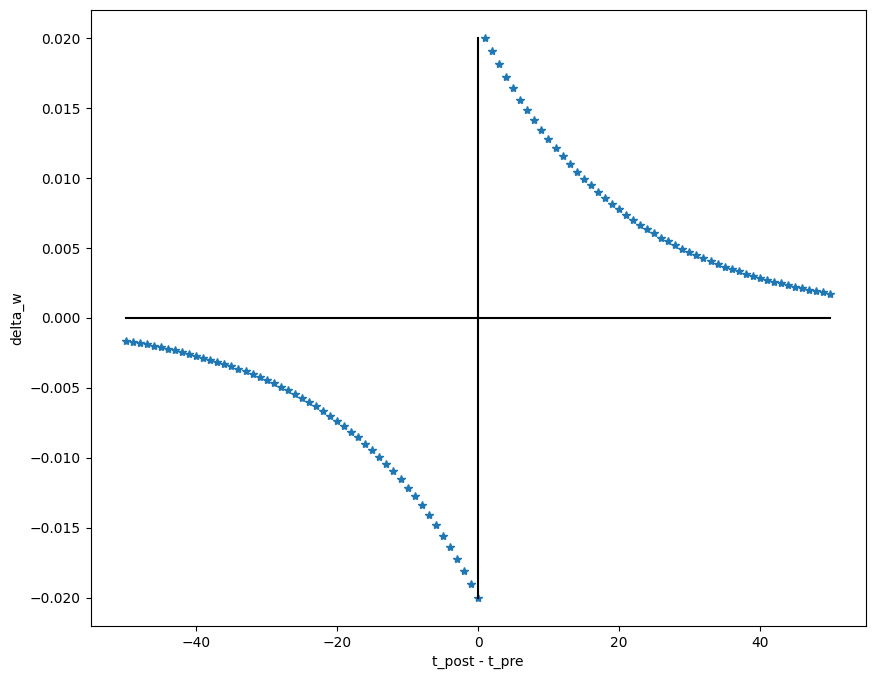
weight_changes.append(delta_w)We can now plot the classical STDP figure:
plt.figure(figsize=(10, 8))
plt.plot(50. - pre_times, weight_changes, "*")
plt.plot([-50, 50], [0, 0], 'k')
plt.plot([0, 0], [min(weight_changes), max(weight_changes)], 'k')
plt.xlabel("t_post - t_pre")
plt.ylabel("delta_w")
plt.show()