#!pip install ANNarchySTDP - network
![]()
![]()
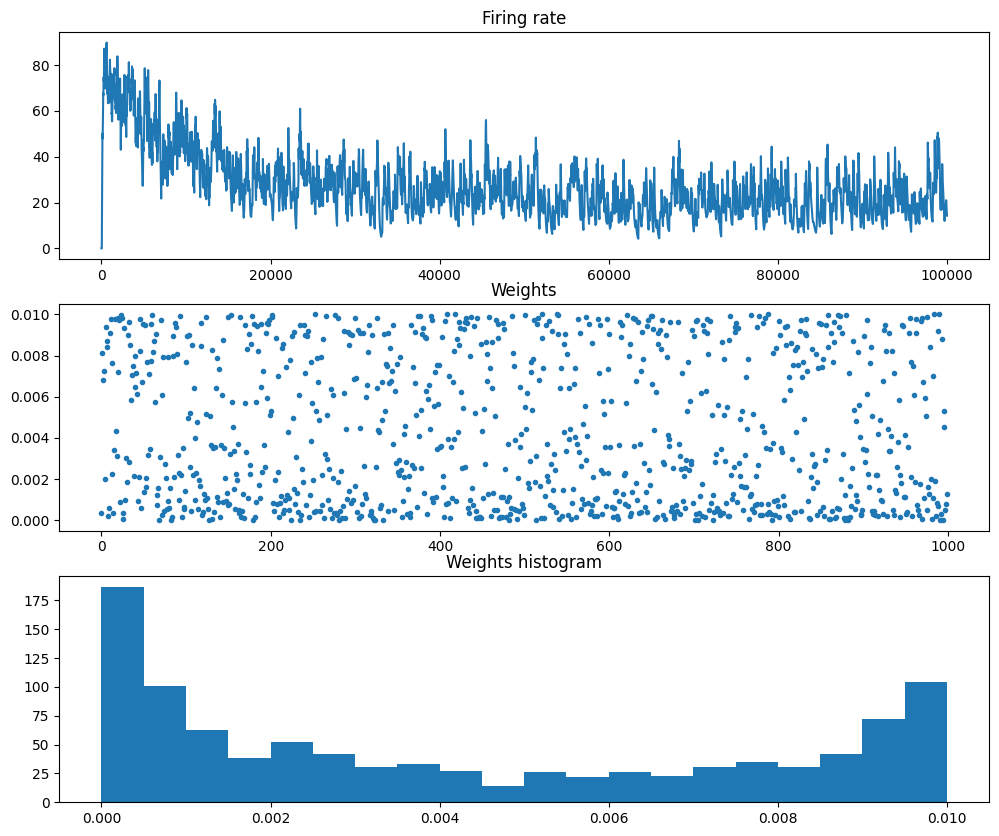
A simple model showing the STDP learning rule on inputs converginf to a single neuron. Model adapted from Song, Miller and Abbott (2000) and Song and Abbott (2001)
Code adapted from the Brian example: http://brian.readthedocs.org/en/1.4.1/examples-plasticity_STDP1.html
import numpy as np
import matplotlib.pyplot as plt

import ANNarchy as ann
ANNarchy 4.8 (4.8.2) on darwin (posix).Some parameters:
F = 15.0 # Poisson distribution at 15 Hz
N = 1000 # 1000 Poisson inputs
gmax = 0.01 # Maximum weight
duration = 100000.0 # Simulation for 100 seconds
Integrate-and-fire neuron:
IF = ann.Neuron(
    parameters = """
        tau_m = 10.0
        tau_e = 5.0
        vt = -54.0
        vr = -60.0
        El = -74.0
        Ee = 0.0
    """,
    equations = """
        tau_m * dv/dt = El - v + g_exc * (Ee - vr) : init = -60.0
        tau_e * dg_exc/dt = - g_exc
    """,
    spike = """
        v > vt
    """,
    reset = """
        v = vr
    """
)
An input population of Poisson neurons, and a single post-synaptic neuron.
# Input population
Input = ann.PoissonPopulation(name = 'Input', geometry=N, rates=F)

# Output neuron
Output = ann.Population(name = 'Output', geometry=1, neuron=IF)

# Projection learned using STDP
proj = ann.Projection(
    pre = Input,
    post = Output,
    target = 'exc',
    synapse = ann.STDP(tau_plus=20.0, tau_minus=20.0, A_plus=0.01, A_minus=0.0105, w_max=0.01)
)
proj.connect_all_to_all(weights=ann.Uniform(0.0, gmax))


# Compile the network
ann.compile()
Compiling ... OK # Start recording
Mi = ann.Monitor(Input, 'spike')
Mo = ann.Monitor(Output, 'spike')
# Start the simulation
ann.simulate(duration, measure_time=True)
# Retrieve the recordings
input_spikes = Mi.get('spike')
output_spikes = Mo.get('spike')Simulating 100.0 seconds of the network took 0.48438501358032227 seconds. # Compute the mean firing rates during the simulation
print('Mean firing rate in the input population: ' + str(Mi.mean_fr(input_spikes)) )
print('Mean firing rate of the output neuron: ' + str(Mo.mean_fr(output_spikes)) )
# Compute the instantaneous firing rate of the output neuron
output_rate = Mo.smoothed_rate(output_spikes, 100.0)
# Receptive field after simulation
weights = proj.w[0]Mean firing rate in the input population: 15.0327
Mean firing rate of the output neuron: 26.99plt.figure(figsize=(12, 10))
plt.subplot(3,1,1)
plt.title('Firing rate')
plt.plot(output_rate[0, :])
plt.subplot(3,1,2)
plt.title('Weights')
plt.plot(weights, '.')
plt.subplot(3,1,3)
plt.title('Weights histogram')
plt.hist(weights, bins=20)
plt.show()